DRAFT
Tracking Down a Memory Leak in Bevy
Recently I fixed a memory leak in Bevy. The issue was reported here. The example code just uses the default plugins and spawns a single camera.
use ;
So with some simple theorizing, we can guess that the problem is related to rendering. Most of that logic doesn't run when there isn't a camera. Unfortunately this doesn't narrow the problem much as rendering is a fairly large portion of the code base. We also probably know that this is probably caused by some thing that keeps growing in size or a something like a circular reference. This is because rust is pretty good at deallocating things automatically when they are no longer used. This theorizing doesn't really narrow things down too much, so we're going to need some more information to find the leak.
Using some basic memory monitoring tools, we can see that it's about a 2kb/s sized
leak. So it seems to be something that is happening during every frame. There are tools
for investigating all the allocations and deallocations happening in a program. So hopefully we
can use one of those. Unfortunately I'm on Windows, so Valgrind
wasn't an option. It was something that commonly came up when googling for tools.
I eventually found leak-detector-allocator
in crates.io. It seemed pretty promising. leak-detector-allocator replaces the global
allocator in rust and then tracks the allocations and deallocations in your rust program.
It only reports any allocations without a corresponding deallocation. This seemed like
it would work reasonably well if I could get it to work.
After a bit of weirdness with the program crashing due to the stack getting too big. I
was able to cobble together some code that did work. Below is code that combines the code
from the issue with the example code from leak-detector-allocator. It logs the allocated
memory for specific frames, which we can then compare to each other. Note that
using the allocator makes things run around 10x slower and I'm also using debug mode to get the better
symbol names. So hopefully it'll be obvious within the first few hundred frames or so what the memory leak
is or else I'm going to be waiting around a lot. Given the earlier investigations with just watching the
total memory use, I'm pretty sure this will work.
use ;
use LeakTracer;
static LEAK_TRACER: = new;
// sample output
leak memory address: 0x1a112603bf0, size: 640
	0x7ff773919fcd, backtrace::backtrace::trace_unsynchronized<leak_detect_allocator::impl$0::alloc_accounting::closure_env$0<10> >
	0x7ff773919fcd, backtrace::backtrace::trace_unsynchronized<leak_detect_allocator::impl$0::alloc_accounting::closure_env$0<10> >
	0x7ff7739116a6, leak_detect_allocator::LeakTracer<10>::alloc_accounting<10>
	0x7ff773911a2f, leak_detect_allocator::impl$1::alloc<10>
	0x7ff77391822c, ecs_guide::_::__rg_alloc
	0x7ff775a2024f, alloc::alloc::Global::alloc_impl
	0x7ff775a20b7d, alloc::alloc::impl$1::allocate
	0x7ff775a1d148, alloc::raw_vec::finish_grow<alloc::alloc::Global>
	0x7ff775998741, alloc::raw_vec::RawVec<bevy_ecs::archetype::Archetype,alloc::alloc::Global>::grow_amortized<bevy_ecs::archetype::Archetype,alloc::alloc::Global>
	0x7ff77599c0d9, alloc::raw_vec::RawVec<bevy_ecs::archetype::Archetype,alloc::alloc::Global>::reserve_for_push<bevy_ecs::archetype::Archetype,alloc::alloc::Global>

total address:11169, bytes:5827857
The output is a text file with a ton of entries like the above. It has an address, the size
of the allocation, and a simple stack trace. For the above we see that we allocated 640 bytes
for a RawVec<Archetype>. At the end of the file is the total number of address and bytes that
are allocated. To find the leak we will need to compare the output from different frames as bevy
is a program and uses memory so there will be many allocations that show. // awkward phrasing
VSCode can show the diffs between two different text files. So we use that functionality and then manually go through the diffs. We're looking for an allocation that is growing in size or a bunch of somethings that are never getting deallocated.
 // diff of allocationed memory from different frames
Even just looking at the diffs there ends up being a lot of things that are just normal operation of the program. It's pretty normal for things to be allocated for a bit, but then get dealllocated later. A lot of these are happening every frame and it's fairly easy to ignore most of these. We can identify these since they are the same size and even line up in the diff frame to frame. This assumption would have been harder to make if the scene was more dynamic.
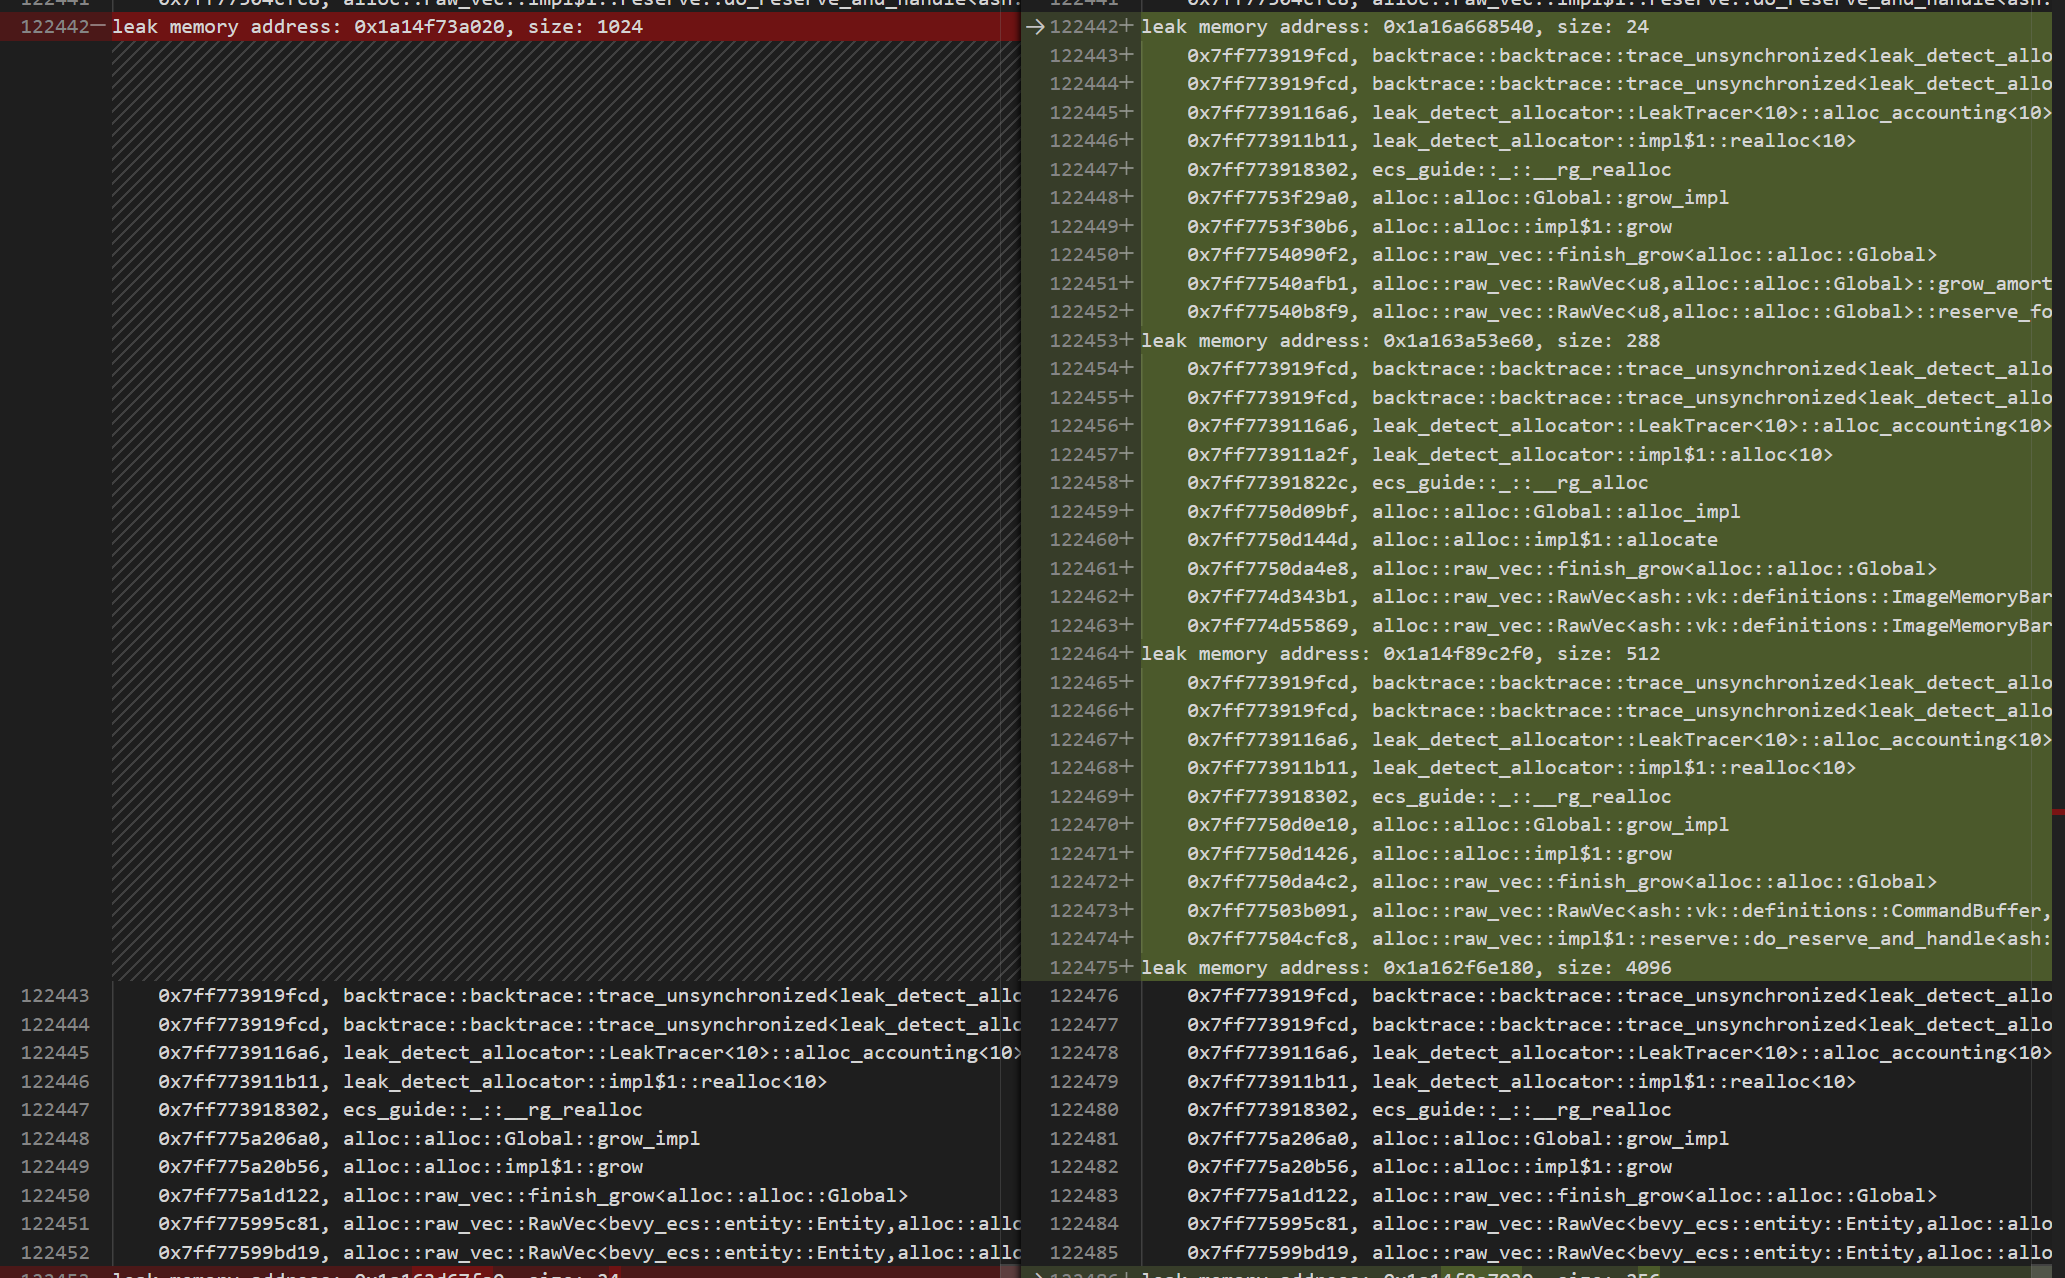
Scanning through the diffs that aren't so obvious, I end up seeing this suspicious entry.
 // RawVec
The first thing to notice that the allocation on the right is fairly large compared
to others at 4096 bytes. And we can also see a similar deallocation on the left that is
of the same RawVec<Entity> type that is only 1024 bytes.
So it seems a RawVec<Entity> is growing
across multiple frames. This is a probably actually a Vec<Entity>
as RawVec is the underlying storage for a Vec. One thing to note about a vec is
typically reallocated by doubling it's capacity, so we don't always see it grow
between frames. In this case it takes 240 frames to go to 4x the capacity. This pattern
of growth also seemed to be happening when watching the total memory used value in something
like the windows task manager. As the memory leak grew larger the time it would take for
the amount of memory commited to change would take longer and longer. So this seems like a
likely suspect.
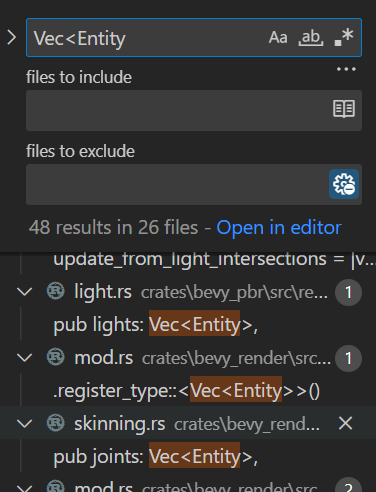
Now we just need to figure out which Vec<Entity> is growing. Doing a text search shows some
candidates.
 // Small clip of VSCode search for Vec
Most of the things found are related to rendering. These are things like
caching the VisibleEntities, Bones, etc. Checking them by running a dbg!(Vec::capacity)
shows that most of these are zero. This is unsurprising since the scene is empty, but
still worth ruling out.
Oh, but what's this...a VecWorld::clear_trackers in the main
schedule, so is probably not leaking there. But besides the main world there
is a separate render world. The render world exists to completely separate the data
needed for simulation vs the data needed for rendering, so that the two schedules can
run in parallel. It's possible that clear_trackers is not being called on the render
world. Checking RemovedComponents's capacity on the render world quickly confirms that this
is the problem. And from a quick search it is confirmed that clear_trackers is only being
called on the main world. Horay! We've found at least one memory leak.
An easy fix is to just call clear_trackers in the render world's schedule. But rendering
is using an abstraction called SubApp's and users are able to add their own sub apps. So
it'd be best to fix this in a way that works both for all aub apps. So instead we run it in
App::update so it can't be forgotten to be called as long as we're using bevy_app. We
also move the call for the main world into this function for consistency's sake.
Running the allocation tracer with this fix for 10000 frames confirms that memory use is no longer growing in the example. So it's confirmed this at least fixes the memmory leaks in the simple example.
I'm not sure how generally useful this technique will be. The scene was fairly static, so the noisiness of the allocations wasn't too bad. But with a more dynamic scene I imagine there would be many more allocations to sort through and not all of them will line up as neatly. But hopefully this can still work to some degree.